PROJECT 1 (time-series):PREDICTING UNEMPLOYMENT RATE IN OSUN STATE
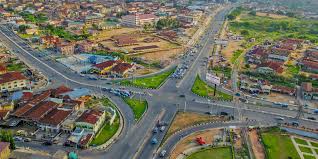 Freedom park, Osogbo (2020)s
This project is aim at solving problems & getting insights indigenous to my country Nigeria, Osun state to be precise. I initially used a linear regression model, but since I am now with more skills, I have choosen to use FbProphet model(Time_series_analysis).
Freedom park, Osogbo (2020)s
This project is aim at solving problems & getting insights indigenous to my country Nigeria, Osun state to be precise. I initially used a linear regression model, but since I am now with more skills, I have choosen to use FbProphet model(Time_series_analysis).
Although, there is a challenge of a reliable central data in Nigeria, I was able to scrap data from opendataforafrica.org using pandas library. Also, I used python library like seaborn, matplotlib, scipy, fbprophet ETC.
The objective is to:
- Visualize these data with EDA
- Check for relationship and correlation
- Preprocess Data,to make it suitable for modelling
- Fit model to predict Unemployment rate(UER) and Evaluate model Note: The data analysis is meant for Osun state only (Not Nigeria) and I am liable to my errors and choice of model.
UNEMPLOYMENT RATE (UER) HAS STRONG POSITIVE CORRELATION with;
- P.I POVERTY INCIDENCE(0.88),
- I.E INCOME INEQUALITY (0.88),
- G.O Graduate output (0.50),
- TOTAL POPULATION T,P (0.61),
- & Population living on dollar PD (0.88)
 Using Facebook Prophet model for Unemployment rate (UER)
Osun state is mainly an agrarian state, hence most of her metrics is agricultural. I abbreviated some of this metrics and instead of using request,bs4 or selenium to scrape data , I used Pandas Library which is easier.
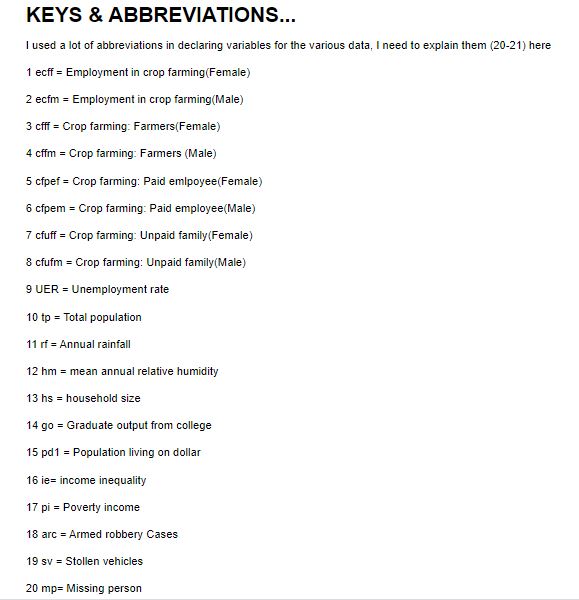 Keys
Keys
- DATA MINING & CLEANING
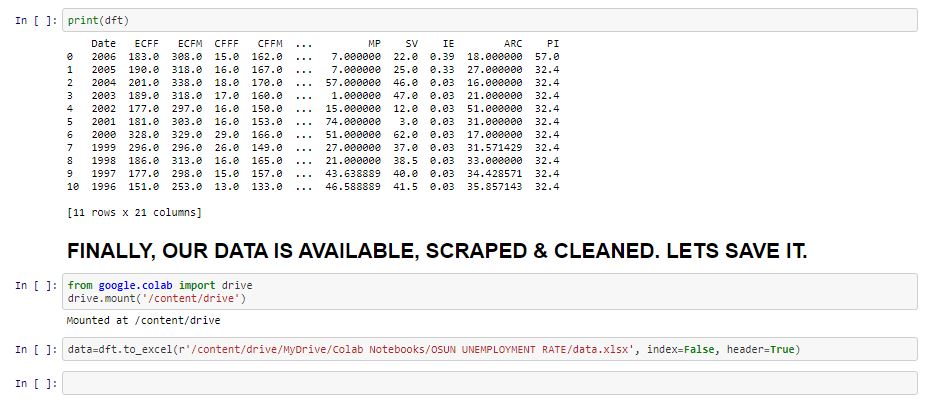
The next step is to use Pandas ‘read_html’ function to scrape the tables from each url link supplied, and then parse them to dataframe and date-time objects.
Some of the scraped data were missing (NaN), So I used imputation method (Linear regression) to fill them. However, some columns value were inadequate and gives rise to Negative values(high slope). Again, I used front fill method (last available values) to fill empty values.
In the end, the table look like this:
 **
**
- EXPLORATORY DATA ANALYSIS
I used the ‘describe’ function to get the mean, std, count, min & max values ETC. Using a simple line plot, it shows: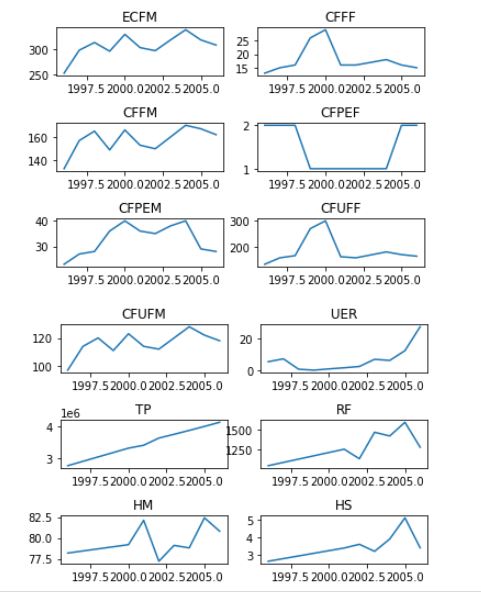 Exploratory analysis
To find the correlation between all these features, I used the ‘corr()’ function & Seaborn heat map function.
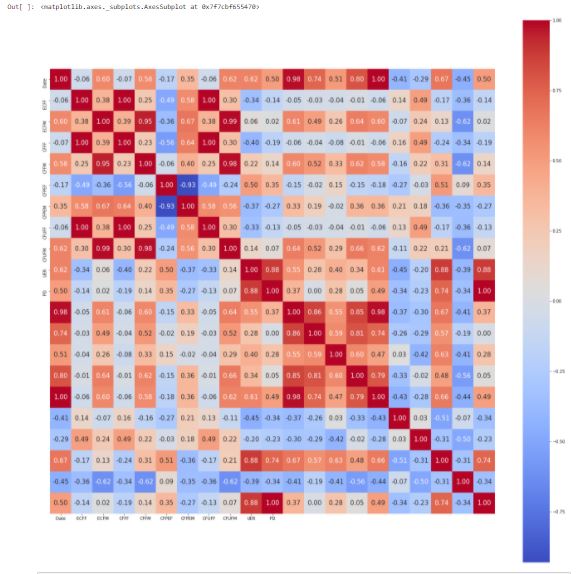 correlation Heatmap
THE MATRIX SHOWS A LOT OF CORELATIONS BETWEEN THE FEATURES… BUT OUR OBJECTIVE IS UNEMPLOYMENT RATE (UER) UER HAS STRONG POSITIVE CORRELATION with P.I POVERTY INCIDENCE(0.88), I.E INCOME INEQUALITY (0.88), G.O Graduate output (0.50), TOTAL POPULATION T,P (0.61), & Population living on dollar PD (0.88).
3 DATA PRE-PROCESSING Feeding raw unprocessed data to models will cause the models to be biased, hence I used the boxcox from scipy to transform the data. Note the graph before and after transformation.
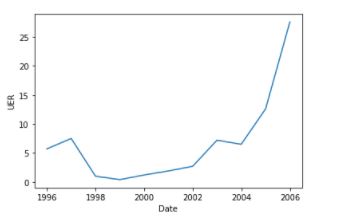 before transformation
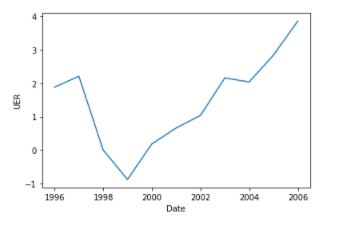 after transformation
-
FEATURE SELECTION Using fbprophet librabry, date is converted to datestamp (ds) and UER to ‘y’.
-
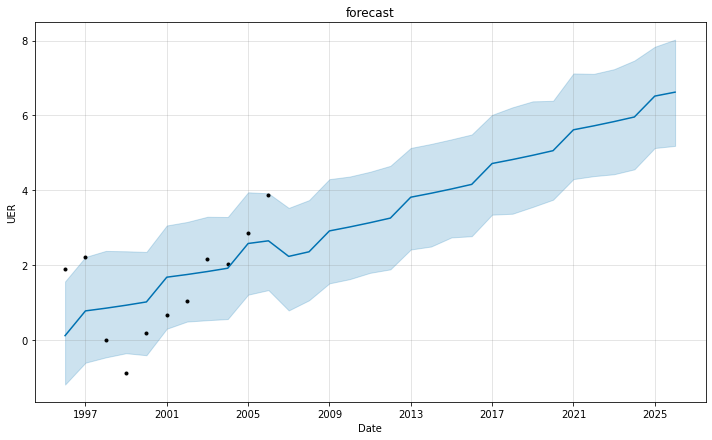
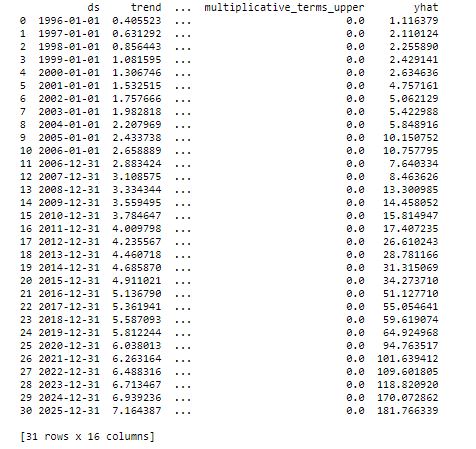
FITTING & FORECAST After fitting the data, the model is then used to forecast the next 20 years.
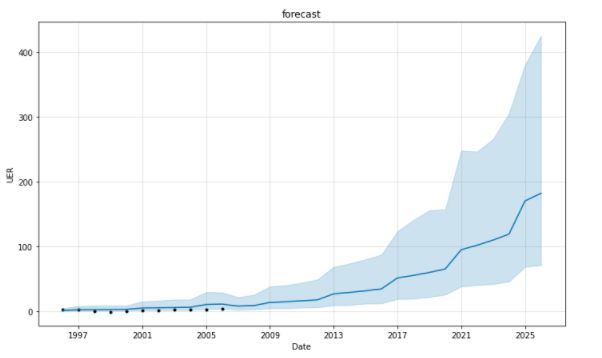 Using FbProphet to forecast UER for 20 years
 Using FbProphet to forecast UER for 20 years
- EVALUATING MODEL (for 365 days) The root mean sqaure error (RMSE=1.66) and Mean Absolute error (MAE=0.55) shows the model is effective for the forecast
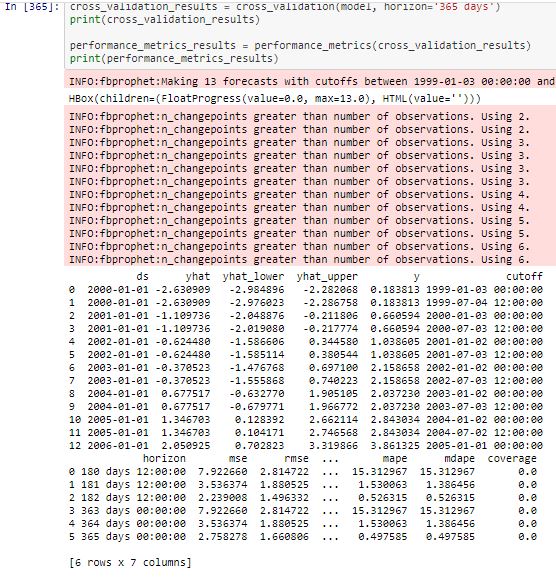 Model Evaluation
You can check my github page for source code
Thank you.